Visualization using Amazon Quicksight
-
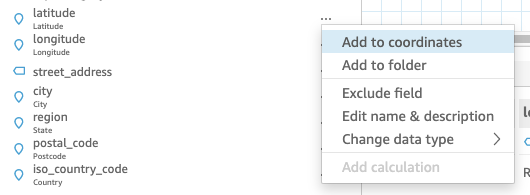
In the Dataset preview / edit screen, you can create a field hierarchy for your geospatial visualization
a. Click on three dots on the right side of “latitude” field, then choose “Add to Coordinate”
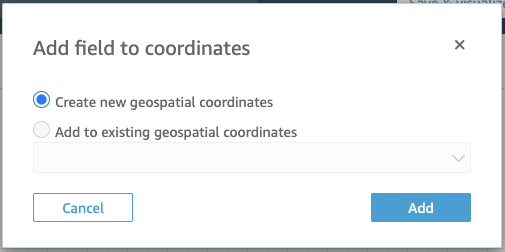
b. Choose “Create a new geospatial coordinates”
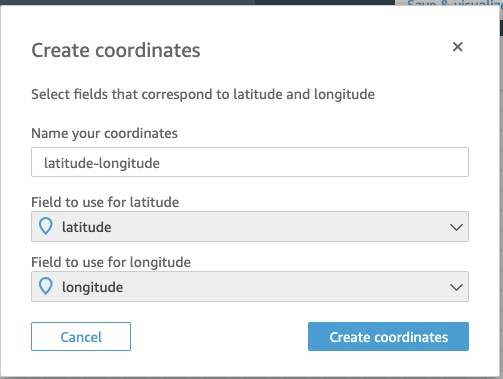
c. Choose latitude and longitude for each fields
d. Click “Save & Visualize” from the top navigation panel
-
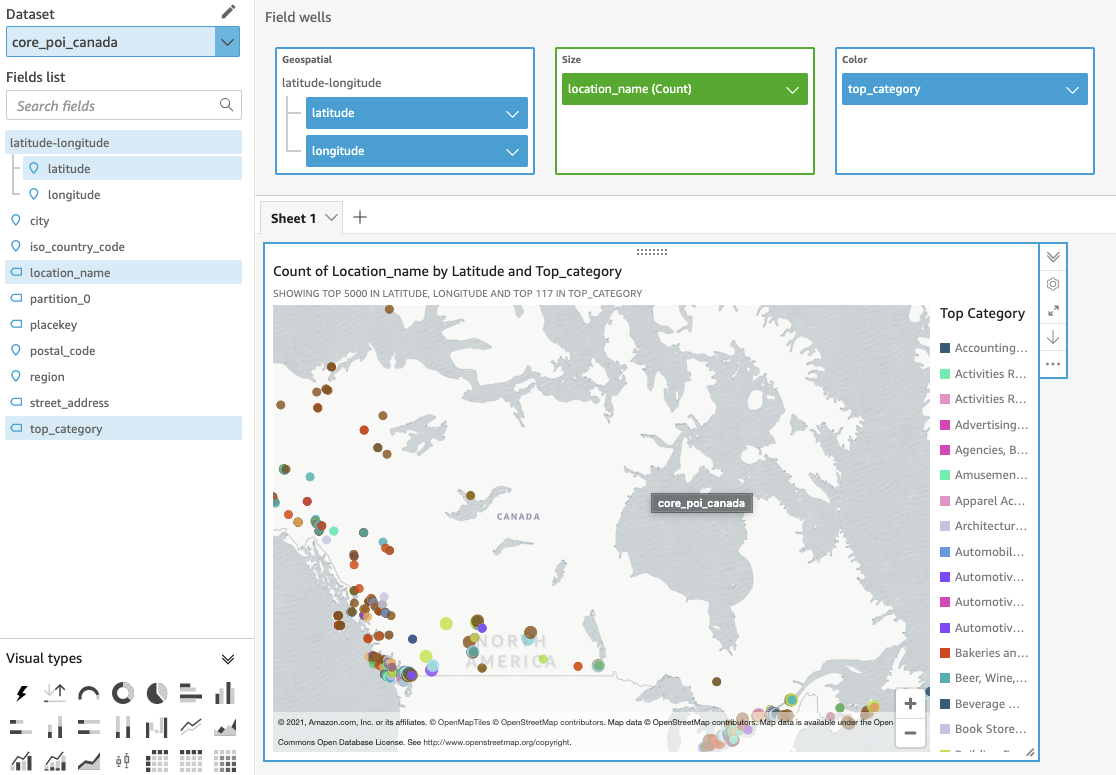
From the “Visual types”, choose “Points on map”

-
Click & Drag the followings from sield list to the “Field wells”, latitude-longitude to “Geospatial”, location_name to “Size”, and top_category to “Color”
-
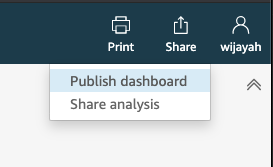
After you finish setting up the visualization you can publish a dashboard by clicking “Share” - “Publish dashboard”
-
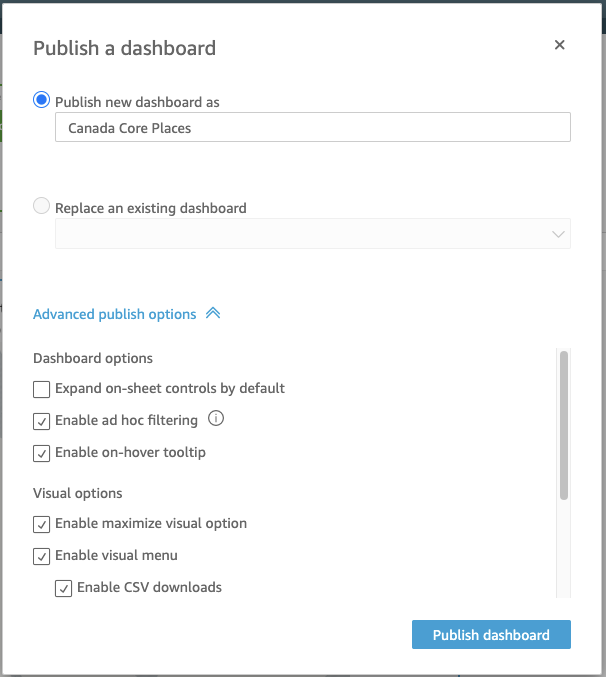
Specify the name you want for your dashboard, expand “Advanced publish options”, and select “Enabled ad hoc filtering”
-
You can interact with the dashboard by adding filter, zoom in and out the map
